So in light of New York City’s new “covid zone’s” micro-cluster approach to pandemic management, I need to re-write the Agile Learning Center’s plan for operations this year.
I published the plan in July, knowing that parents would feel better with *something* concrete heading into the school year rather than having plans unknown and changing on them in real time as we rolled into September. That plan was cautious, dynamic, thorough, and for the most part it doesn’t need adapting. But some things have changed or become clear in the first 7 weeks of school:
- Cuomo’s executive order a few weeks ago introduced
“zones” that come with legal restrictions. - Families and facilitators generally feel comfortable meeting in small groups, masked, outside even with case numbers in the city higher than the threshold we established as part of our “baseline” conditions for in-person meet-ups based on July research. More than that, several families have indicated that being able to have childcare//in-person socialization is particularly important for them.
- While we tried to account for day-to-day fluctuations by basing our threshold on 14-day trends (+ a max. % of est. city population), current guidance is to look at daily 7 day rolling averages for cases and positivity rates, to look at positivity rates carefully since they’re a complex metric tied to testing as much as to virus spread, and to not expect up-to-date reporting of case numbers (or sometimes even for the numbers to match across reputable websites).
- Moving into the school year, folks added their new school pod to their existing social pods from the summer. This means that on top of the anticipated exposure from household members, folks are also bringing exposure from households where they’re having playdates and dinners. This is both awesome news for kids’ social connections being maintained and really concerning in that it significantly increases the risk we pose to each other in our pods.
Considering all this (and the research directly related to virus transmission that’s been published in the last 4 months), in rewriting our plan I’m thinking about reasonable thresholds for starting/stopping in-person gatherings. I’m thinking about how the state sets restrictions for how school can operate if it’s address ends up in a yellow-orange-red zone, but what about if a facilitator or kid’s home in a different neighborhood is in one? Finally, I’m thinking about how to honor that people have different comfort levels around their socialization right now and/but we have community members to keep safe and are a much higher risk to them if a bunch of us are moving between pods, especially as we head into the winter months where most socializing folks will tend to do will be indoors.
Tonigh I’m reading about what other institutions and organizations use as thresholds for deeming pandemic prevalence too risky for being out and about.
I looked at these data sites just to get a pulse for the world and set my expectations: https://projects.thecity.nyc/2020_03_covid-19-tracker/ and https://access.nyc.gov/coronavirus-covid-19-updates/ and https://ourworldindata.org/coronavirus
I read that the WHO has said the percent of tests coming back positive over a course of two weeks should be below 5% before countries “reopen.” I read more about that at https://coronavirus.jhu.edu/testing/testing-positivity but then appreciated how this article problematizes the idea of just looking at % tests positive : % tests overall. It also gets into the pros/cons of making moves based on hyperlocal data, which was helpful as I read through the info from the DOH guidance on micro-clusters that my last post was about.
I read here that the CDC has something called an “epidemic threshold,” but then I went looking for the definition and found it only applies to deaths and that “This ‘epidemic threshold’ wording only refers to deaths related to COVID-19, which are a lagging indicator of disease activity. The death data is also something that gets filled in as more data – in this case death certificates – are added,” (Kristen Nordlund, a CDC spokeswoman) https://www.usatoday.com/story/news/factcheck/2020/07/22/fact-check-covid-19-isnt-losing-epidemic-status/5435094002/
I looked at the CDC thresholds for issuing warnings against travelling into covid areas (and yikes…NYC doesn’t look too good by these measures):
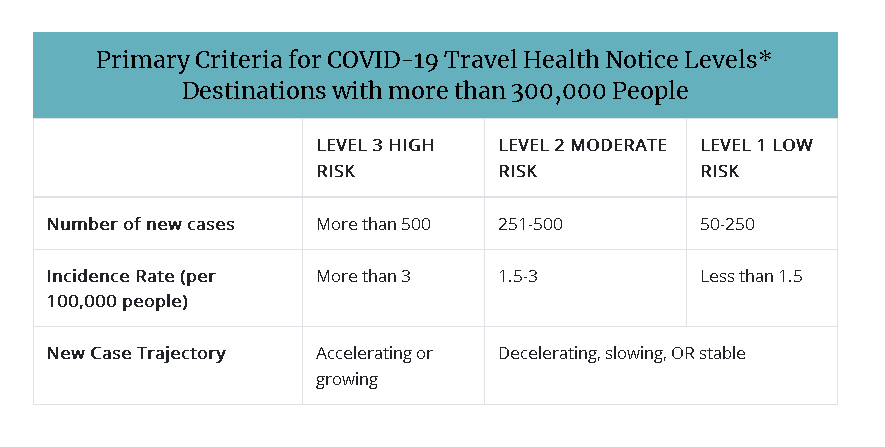
I read how Germany tested using a number of new cases out of 100,000 inhabitants of an area (50 over seven days was their threshold for shutting down reopened businesses again), though that doesn’t seem to have worked. The Salon article linked about talks about how Texas tried the same metric but went for a positivity rate of 10 of 100,000 inhabitants of an area…and the trends there indicate that they either needed a lower threshold or more widespread adoption of safety measures (or both).
Looking at the Google Maps covid filter and at NYS’s criteria for adding states — other than PA, NJ, and CT?! — to our restricted travel list, that “daily 7 day rolling average of X cases per 100,000 inhabitants” sustained for 7 or 10 or 14 days does seem to be the new standard. Below 3 is encouraging, 4-5 restrictions start, and at 10 widespread restrictions kick in…usually also with some attention to the direction of the overall trends.
Not sure what this means yet for the school, but it’s…a start.

Leave a comment